Tag: Analytics
Kusto’s 10-Year Evolution at Microsoft
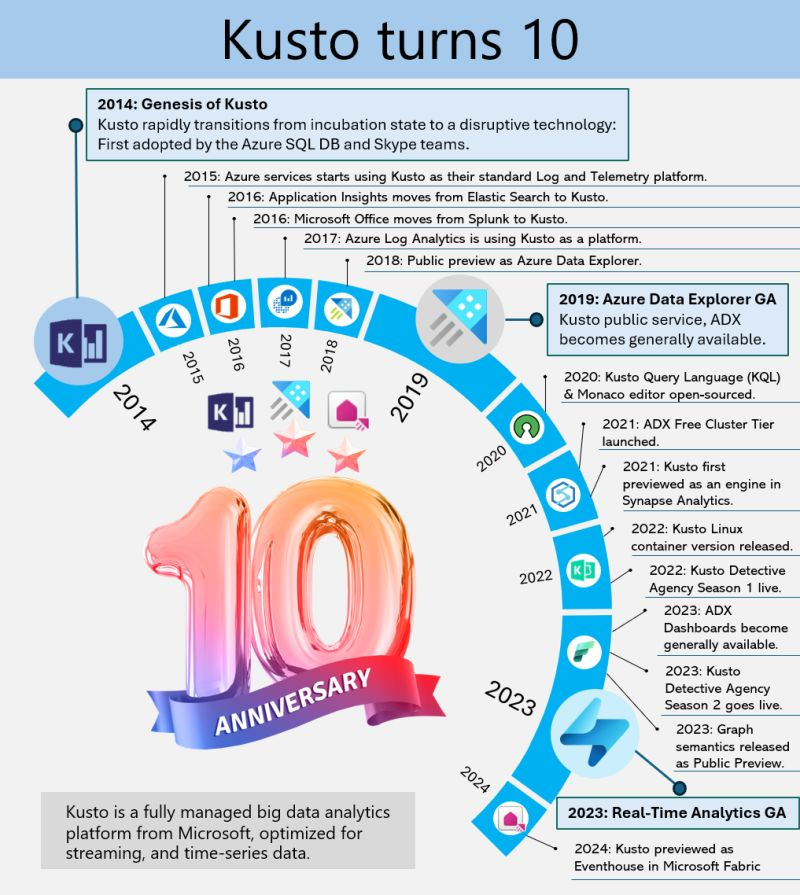
Kusto, the internal service driving Microsoft’s telemetry and several key services, recently marked its 10-year milestone. Over the decade, Kusto has evolved significantly, becoming the backbone for crucial applications such as Sentinel, Application Insights, Azure Data Explorer, and more recently, Eventhouse in Microsoft Fabric. This journey highlights its pivotal role in enhancing data processing, monitoring, and analytics across Microsoft’s ecosystem.
This powerful service has continually adapted to meet the growing demands of Microsoft’s internal and external data needs, underscoring its importance in the company’s broader strategy for data management and analysis.
A Dive into Azure Data Explorer’s Origins
Azure Data Explorer (ADX), initially code-named “Kusto,” has a fascinating backstory. In 2014, it began as a grassroots initiative at Microsoft’s Israel R&D center. The team wanted a name that resonated with their mission of exploring vast data oceans, drawing inspiration from oceanographer Jacques Cousteau. Kusto was designed to tackle the challenges of rapid and scalable log and telemetry analytics, much like Cousteau’s deep-sea explorations.
By 2018, ADX was officially unveiled at the Microsoft Ignite conference, evolving into a fully-managed big data analytics platform. It efficiently handles structured, semi-structured (like JSON), and unstructured data (like free-text). With its powerful querying capabilities and minimal latency, ADX allows users to swiftly explore and analyze data. Remembering its oceanic roots, ADX symbolizes a tribute to the spirit of discovery.
Enjoy!
References
Inserting data to Azure Data Explorer from C#
Here is a great post on inserting data into Azure Data Explorer using C# SDK.
Enjoy!
Discovering Insights with Azure Data Explorer
For the past few months, I’ve been diving into learning Azure Data Explorer (ADX) and using it for a few projects. What is Azure Data Explorer, and what would I use it for? Great questions. Azure Data Explorer is like your data’s best friend when it comes to real-time, heavy-duty analytics. It’s built to handle massive amounts of data—whether it’s structured, semi-structured, or all over the place—and turn it into actionable insights. With its star feature, the Kusto Query Language (KQL), you can dive deep into the data for tasks like spotting trends, detecting anomalies, or analyzing logs, all with ease. It’s perfect for high-speed data streams, making it a go-to for IoT and time-series data. Plus, it’s secure, scalable, and does the hard work fast so you can focus on making more intelligent decisions.
When to use Azure Data Explorer
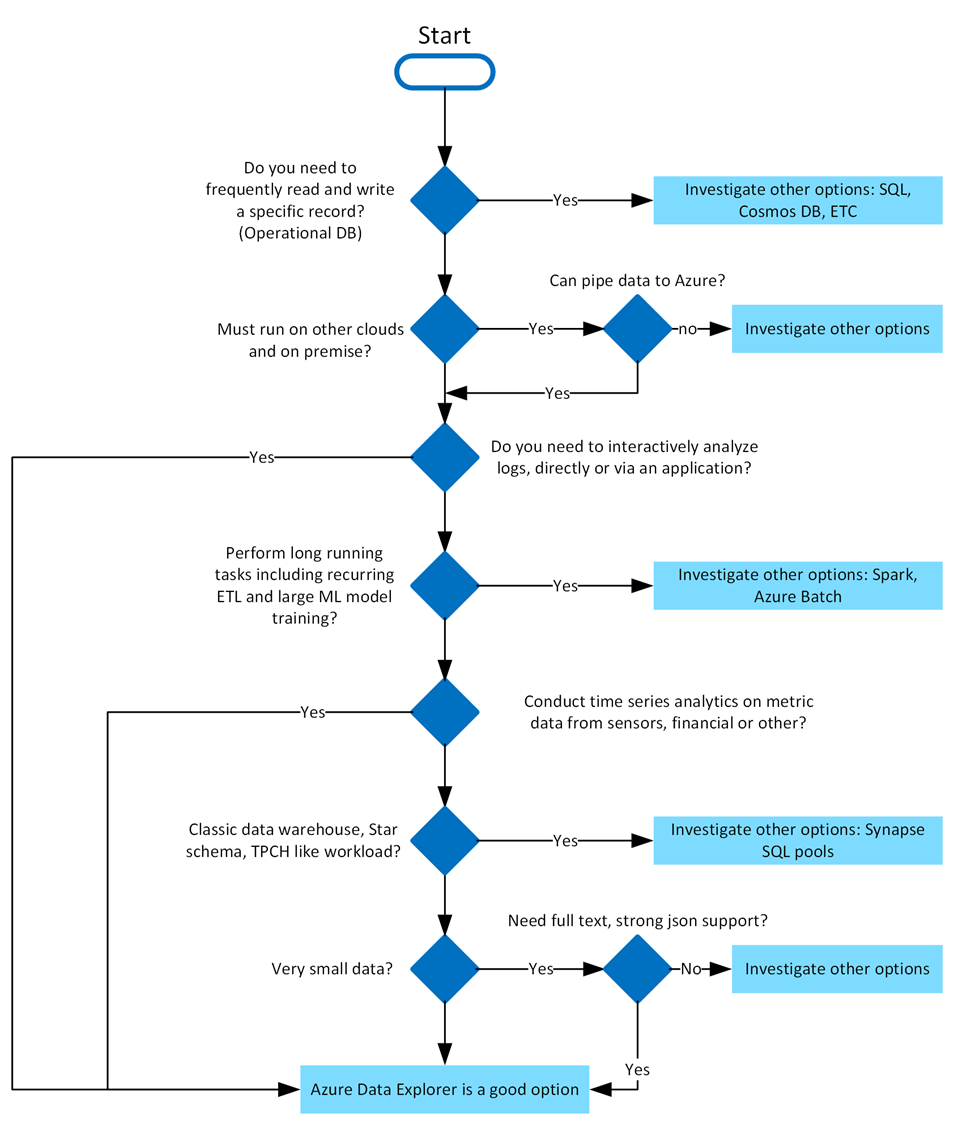
Azure Data Explorer is ideal for enabling interactive analytics capabilities over high-velocity, diverse raw data. Use the following decision tree to help you decide if Azure Data Explorer is right for you:
What makes Azure Data Explorer unique
Azure Data Explorer stands out due to its exceptional capabilities in handling vast amounts of diverse data quickly and efficiently. It supports high-speed data ingestion (terabytes in minutes) and querying of petabytes with millisecond-level results. Its Kusto Query Language (KQL) is intuitive yet powerful, enabling advanced analytics and seamless integration with Python and T-SQL. With specialized features for time series analysis, anomaly detection, and geospatial insights, it’s tailored for deep data exploration. The platform simplifies data ingestion with its user-friendly wizard, while built-in visualization tools and integrations with Power BI, Grafana, Tableau, and more make insights accessible. It also automates data ingestion, transformation, and export, ensuring a smooth, end-to-end analytics experience.
Writing Kusto queries
In Azure Data Explorer, we use the Kusto Query Language (KQL) to write queries. KQL is also used in other Azure services like Azure Monitor Log Analytics, Azure Sentinel, and many more.
- A Kusto query is a read-only request to process data and return results.
- Has one or more query statements and returns data in a tabular or graph format.
- Statements are sequenced by a pipe (|).
- Data flows, or is piped, from one operator to the next.
- The data is filtered/manipulated at each step and then fed into the following step.
- Each time the data passes through another operator, it’s filtered, rearranged, or summarized.
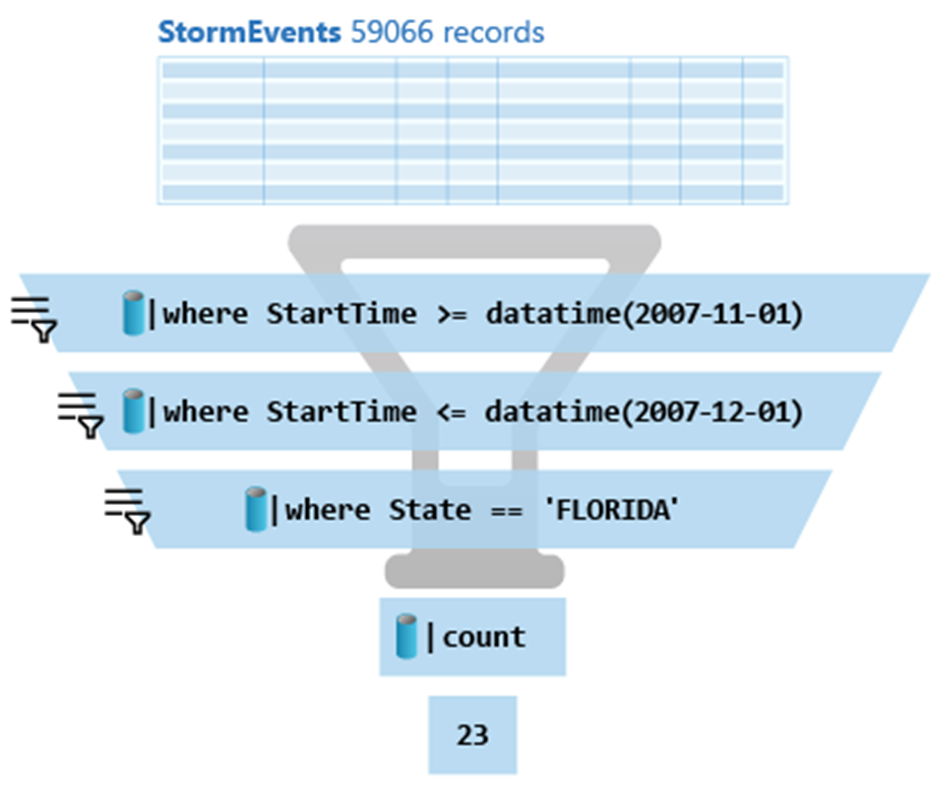
Here is the above query:
StormEvents
| where StartTime >= datetime(2007-11-01)
| where StartTime <= datetime(2007-12-01)
| where State == 'FLORIDA'
| count
Azure Data Explorer query editor also supports the use of T-SQL in addition to its primary query language, Kusto query language (KQL). While KQL is the recommended query language, T-SQL can be useful for tools that are unable to use KQL. For more details, check out how to query data with T-SQL.
Using commands to manage Azure Data Explorer tables
When it comes to writing commands for managing tables, the first character of the text of a request determines if the request is a management command or a query. Management commands must start with the dot (.) character, and no query may start with that character.
Here are some examples of management commands:
- .create table
- .create-merge table
- .drop table
- .alter table
- .rename column
Getting started
You can try Azure Data Explorer for free using the free cluster. Head over to https://dataexplorer.azure.com/ and log in with any Microsoft Account.
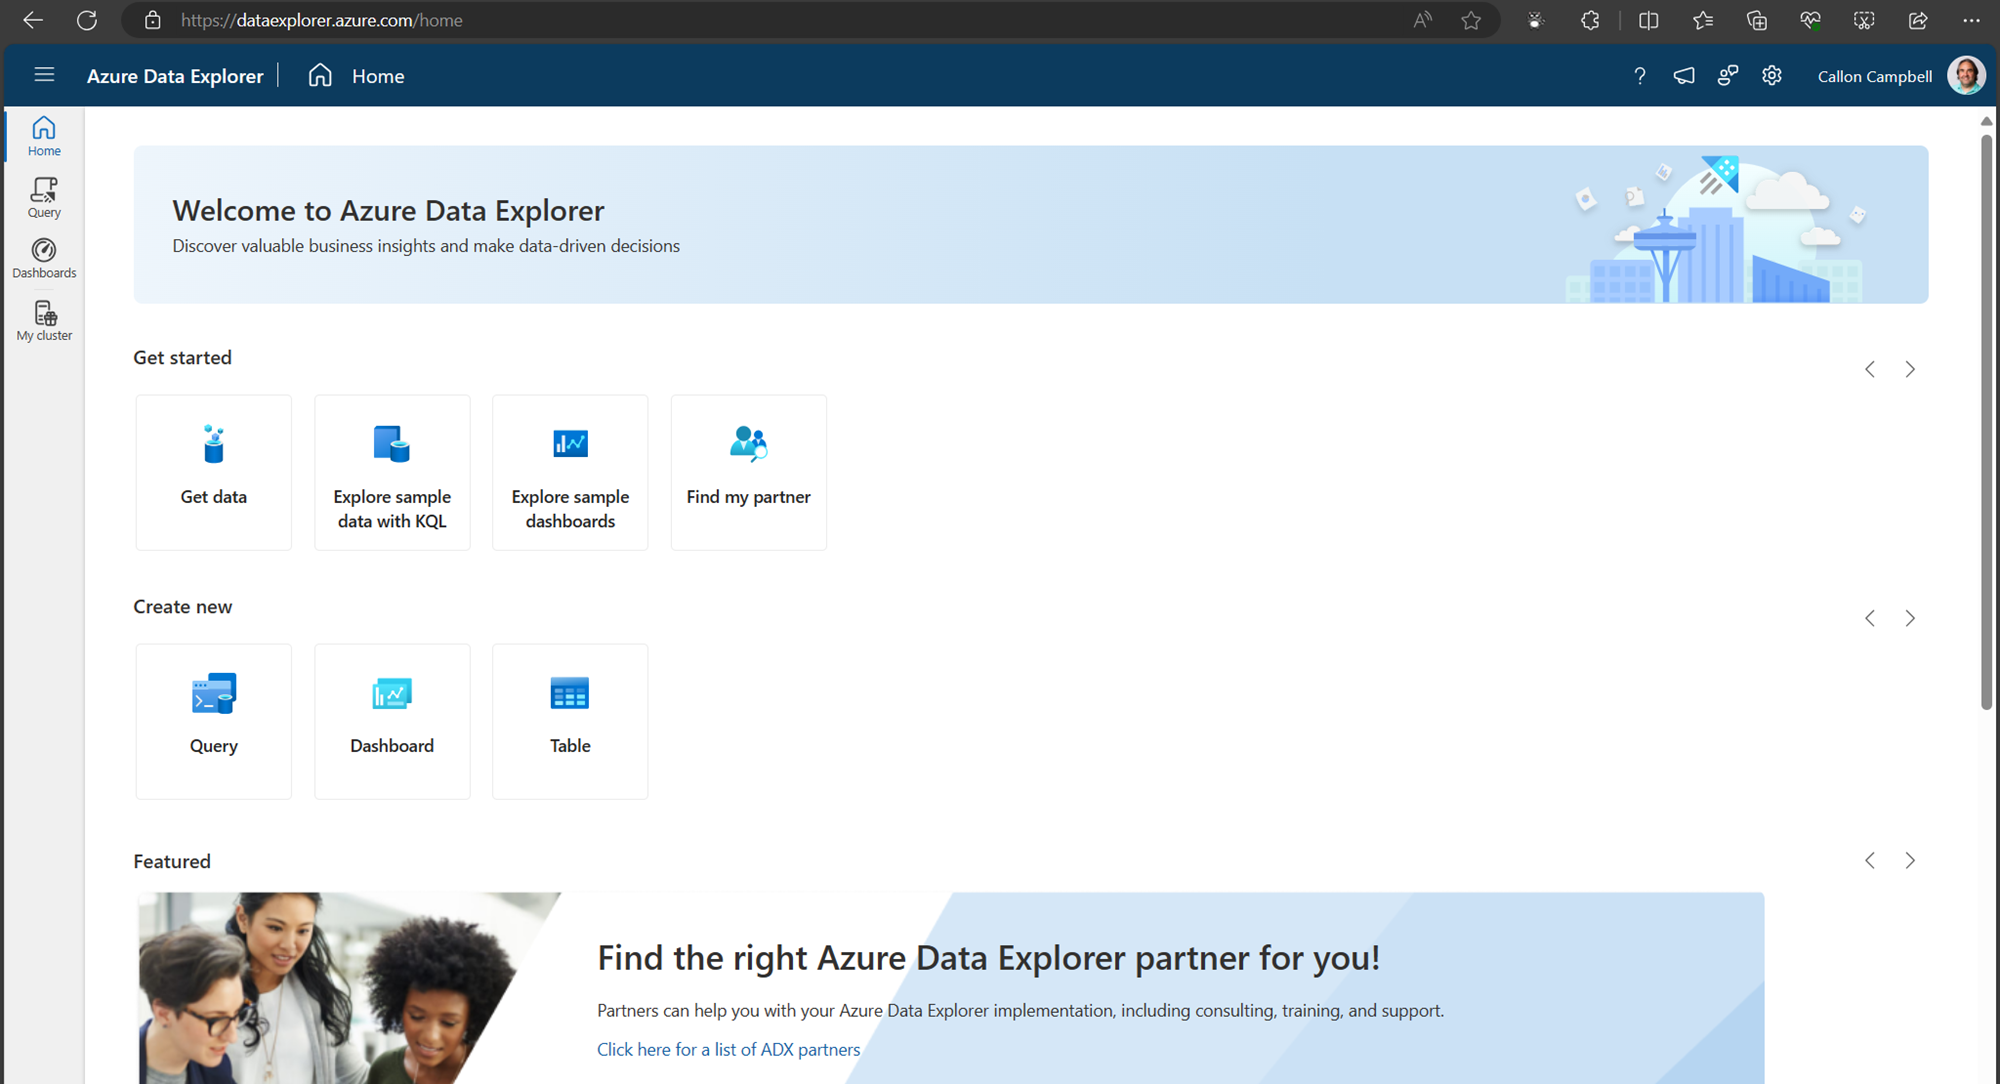
Navigate to the My cluster tab on the left to get access to your cluster URI.
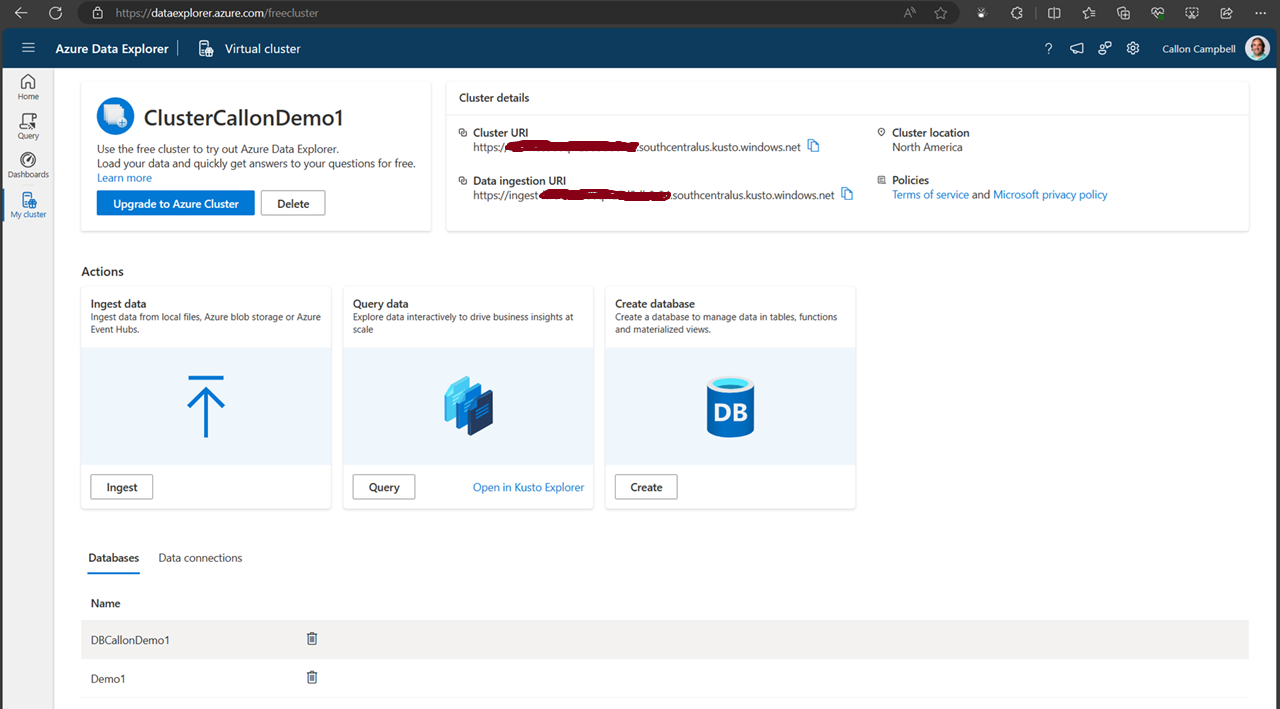
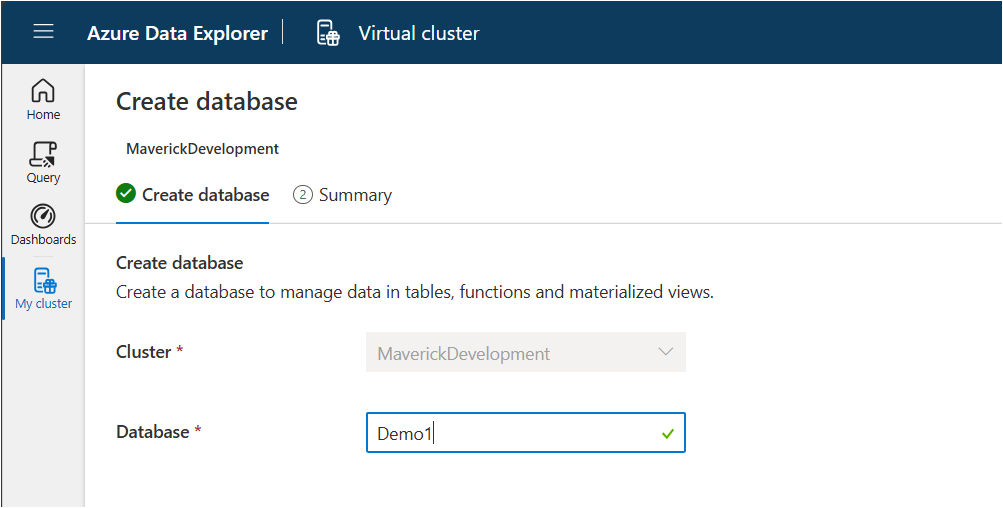
Next, let’s create a new database. While on the My cluster tab, click on the create database button. Give your database a name. In this case, I’m using ‘Demo1’ and then click on the ‘NextCreateDatebase’ button.
Now navigate over to the Query table and lets create our first table, insert some data and run some queries.
Creating a table
.create-merge table customers
(
    FullName: string,
    LastOrderDate: datetime,
    YtdSales: decimal,
    YtdExpenses: decimal,
    City: string,
    PostalCode: string
)
If we run the .show table customers command, we can see the table definition:
.show table customers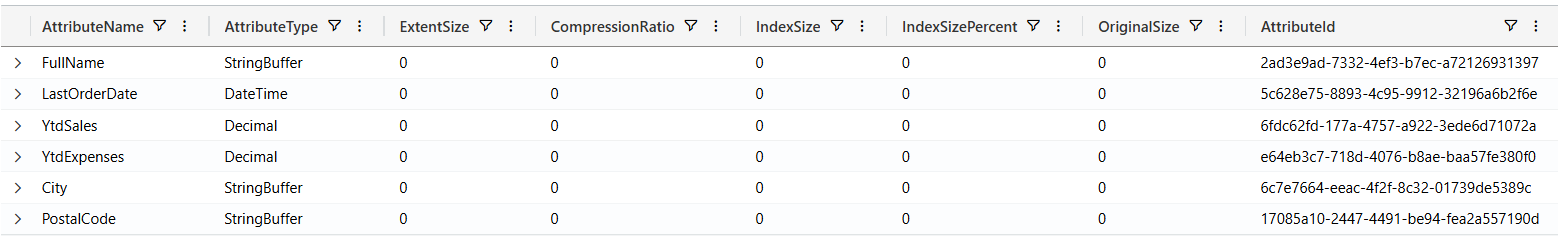
Ingesting data
There are several ways we can ingest data into our table. Here are a few options:
- Ingest from Azure Storage
- Ingest from a Query
- Streaming Ingestion
- Ingest Inline
- Ingest from an application
Today we’re going to be using the inline ingestion, which goes as follows:
.ingest inline into table customers <|
'Bill Gates', datetime(2022-01-10 11:00:00), 1000000, 500000, 'Redmond', '98052'
'Steve Ballmer', datetime(2022-01-06 10:30:00), 150000, 50000, 'Los Angeles', '90305'
'Satya Nadella', datetime(2022-01-09 17:25:00), 100000, 50000, 'Redmond', '98052'
'Steve Jobs', datetime(2022-01-04 13:00:00), 100000, 60000, 'Cupertino', '95014'
'Larry Ellison', datetime(2022-01-04 13:00:00), 90000, 80000, 'Redwood Shores', '94065'
'Jeff Bezos', datetime(2022-01-05 08:00:00), 750000, 650000, 'Seattle', '98109'
'Tim Cook', datetime(2022-01-02 09:00:00), 40000, 10000, 'Cupertino', '95014'
'Steve Wozniak', datetime(2022-01-04 11:30:00), 81000, 55000, 'Cupertino', '95014'
'Scott Guthrie', datetime(2022-01-11 14:00:00), 2000000, 1000000, 'Redmond', '98052'
Querying data
Now, let’s start writing KQL queries against our data. In the following query I’m just using the name of the table with no where clause. This is similar to the “SELECT * FROM Customers” in SQL.
customers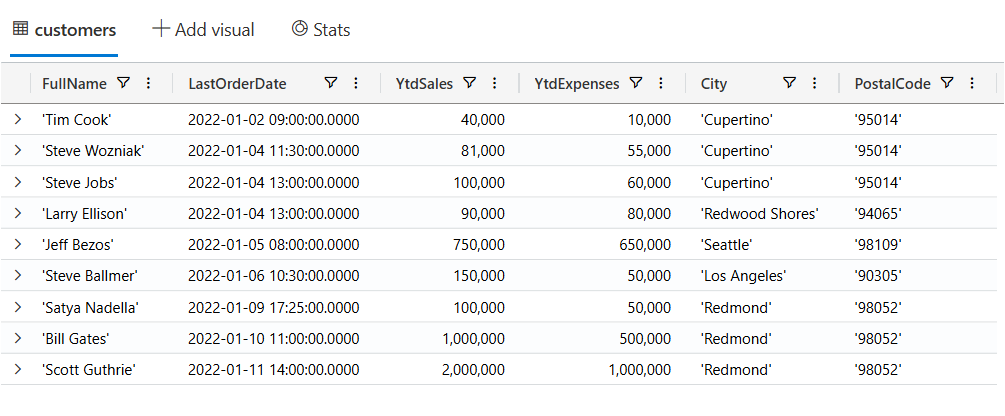
Now let’s filter our data looking for customers where the YtdSales is less than $100,000:
customers
| where YtdSales < 100000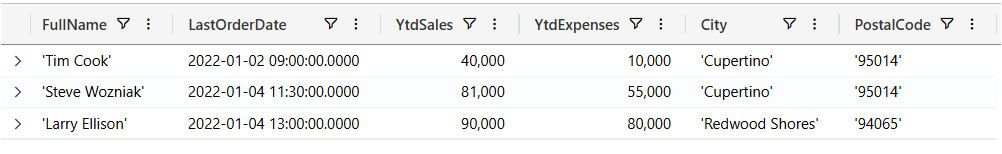
SQL to KQL
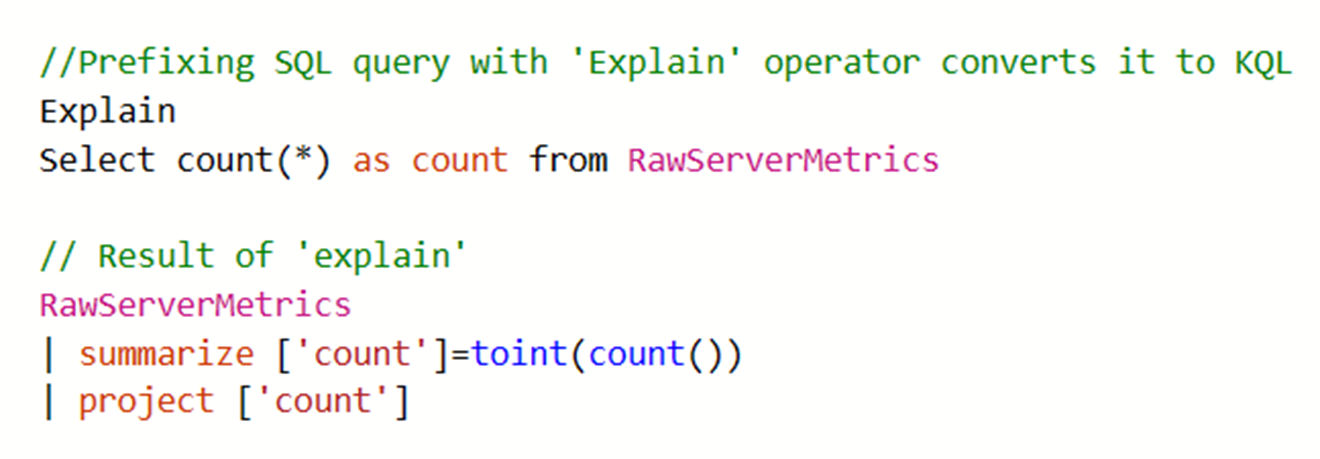
If you’re unfamiliar with KQL but are familiar with SQL and want to learn KQL, you can translate your SQL queries into KQL by prefacing the SQL query with a comment line, --, and the keyword explain. The output shows the KQL version of the query, which can help you understand the KQL syntax and concepts. Here is an example of the ‘EXPLAIN’ operator as follows:
Try the SQL to Kusto Query Language cheat sheet.
Wrapping up
In this post we looked at what Azure Data Explorer is, when it should be used, how to use the free personal cluster to create a sample database and ingest data and the run some queries. I hope this was insightful and I look forward to my next post where I’ll go deeper on ingesting data in real-time and running more complicated queries and how we can access this data from dashboards and APIs.
Enjoy!
References
Industry-aware analytics using Azure Synapse database templates | This week on Azure Friday
In this episode of Azure Friday, Lakshmi Murthy joins Scott Hanselman to show how to build an enterprise data model using Azure Synapse database templates to add rich business context to data and drive meaningful analytics.
Chapters
- 00:00 – Introduction
- 01:07 – Azure Synapse database templates
- 04:54 – Demo: Creating a lake database
- 10:35 – Demo: Customizing and querying
- 17:04 – Wrap-up
Source: Azure Friday
Resources
- Lake database templates – https://aka.ms/azfr/728/01
- Announcing GA of Database Templates in Azure Synapse Analytics – https://aka.ms/azfr/728/02
- How-to: Create a lake database from database templates – https://aka.ms/azfr/728/03
- Create a Pay-as-You-Go account (Azure) – https://aka.ms/azfr/728/payg
- Create a free account (Azure) – https://aka.ms/azfr/728/free
Overview of Monitoring in Azure
Monitoring, monitoring, monitoring! In my opinion as a Systems Architect and Developer for the last 20 years I’ve found that we don’t do enough application and resource logging. It’s only when you start working with DevOps and see how the operations team works with and troubleshoots your applications do you as a developer realize that maybe we should have added more logging to help diagnose and provide valuable insights to the state of your application.
Luckily for us when you deploy your application to Azure there is a breadth of monitoring solutions for collecting, analyzing and acting on telemetry from your application and the Azure resources that support them. These services are categorized into the following four sections:
- Deep Application Monitoring
- Deep Infrastructure Monitoring
- Core Monitoring
- Shared Capabilities

Deep Application Monitoring
Application Insights provides deep insights into your application performance, availability and usage, whether you have it hosted in the cloud or on-premises. Application Insights provides the capability to instrument your own applications, adding events to suit your own needs. Application Insights can be configured for new applications or you can start monitoring an existing application in production without any changes by using an agent.
Application Insights provides you with the ability to quickly identify and diagnose issues in production and can also be used for local and/or QA testing.
When leveraging Application Insights you can take advantage of Application Insights Analytics to detect trends, identify usage behaviors, and perform complex queries, and Application Insights is built upon core monitoring services found in Azure.
Deep Infrastructure Monitoring
On the infrastructure side we have Deep Infrastructure Monitoring is made up Log Analytics, Management Solutions, Service Map, and Network Monitoring which is made up by several tools that work together. These services also build upon core monitoring services in Azure that provide powerful analytics.
Core Monitoring
Core monitoring is standard across Azure resources and require only minimal configuration. Core monitoring provides the necessary telemetry that the premium monitoring services leverage. With Core monitoring we have access to Azure Monitor, Azure Advisor, Azure Service Health, and Activity Logs.
Shared Capabilities
Finally we have the shared monitoring capabilities that the core and deep monitoring services use to provide features like Alerts, Dashboards, and the Metrics Explorer.
Summary
Monitoring is an essential role in any application so that you can collect and analyze data to determine the performance, health and availability of your application and the resources that it depends on. Azure provides a very robust set of services from monitoring your application all the way down to the infrastructure it runs on.
Enjoy!
Resources
Azure Monitoring Docs
Overview of Monitoring in Azure
Explore Azure Monitor to get started with core monitoring metrics and alerts
Explore Application Insights if you’re trying to diagnose problems in your App Service web app
Explore Log Analytics for analyzing collected monitoring data and logs
Monitoring and Scaling your Azure Functions
Everybody loves Azure Functions. My team recently deployed a production service using Azure Functions as the back end backbone. I’d like to share some lessons and tips we learned along the way. We’re using Azure functions in consumption plan – which basically means the platform scales in and out as required without our intervention. But […]
Azure Functions now with Application Insights integration
Earlier this month Azure Functions was updated to have direct integration with Application Insights and is currently only available on the “beta” version of Azure Functions. At this time it’s recommended to only try this out in non-production Azure Function apps until it’s a more stable release.
Getting Started
Before we can enable Azure Function Application Insights integration, we will need to setup an Application Insights instance. If you already have one skip to the next step.
- Create an Application Insights instance and Application Type should be General. Once your Application Insights is setup, copy the instrumentation key which we’ll need in the next step.


- Next you will need to update your Azure Function Application Settings to configure your function to run under the “beta” version and then to set your Application Insights Instrumentation Key.

- Now go to Application Settings and then update App Setting “FUNCTIONS_EXTENSION_VERSION” from “~1” to “beta” and then add a new key named “APPINSIGHTS_INSTRUMENTATIONKEY” and set the value to the Application Insights Instrumentation key you copied in step 1. Now click Save to update your Azure Function.


Once this is done, your Application Insights instance will start collecting telemetry from your Azure Function without any code changes.
Using Application Insights
Going to your Application Insights, you can start to see some metrics showing up on the overview blade:
Live Metrics Stream
You can get a lot more insights to real-time telemetry from the Live Metrics Stream to see what’s happening right now: 
Analytics
Another great resource of Application Insights is the Analytics portal, which provides you the ability to write your own custom queries. 
Alerts
The previous two options are great to see what is happening or what happened historically, but Alerts will tell you what’s happening. I suggest you checkout Alerts from the Application Insights blade, where you can define alerts based on a wide array of metrics.

Summary
You can now add Application Insights to your Azure Functions with minimal effort, which is a powerful tool for monitoring your applications. Keep in mind that this is currently only available in the “beta” version of Azure Functions, but is something that should be coming to the production release in the near future now that it’s been merged into the develop branch on github.
Enjoy!
References
Azure Functions integration with Application Insights
Azure Functions now has direct integration with Application Insights
